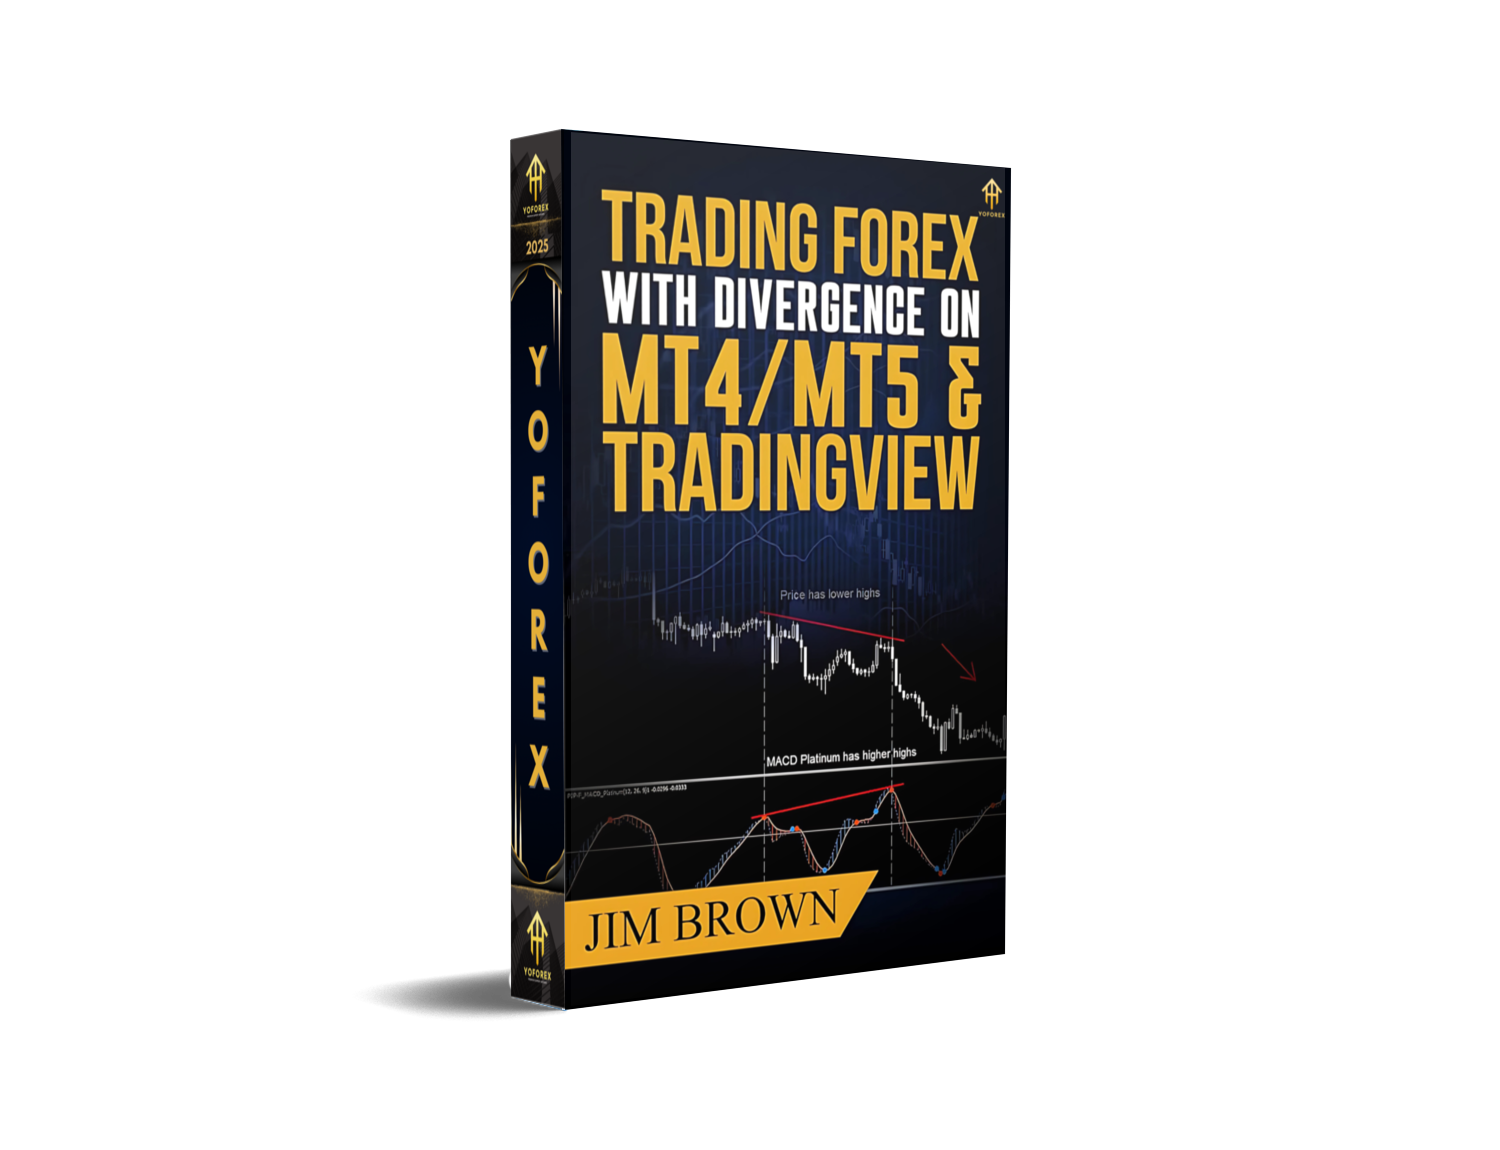
Trading Forex with Divergence on MT4/MT5 & TradingView: A Comprehensive Guide
Forex trading is a dynamic arena where timing and precision separate successful traders from the rest. One of the most powerful technical tools for predicting trend reversals or continuations is divergence—a signal that occurs when price action moves in the opposite direction of an indicator. Whether you’re using MetaTrader 4 (MT4), MetaTrader 5 (MT5), or TradingView, mastering divergence can transform your trading strategy. In this guide, we’ll break down what divergence is, how to detect it using popular indicators, and step-by-step instructions for implementation on all three platforms. By the end, you’ll have the knowledge to turn divergence signals into consistent profits.
What Is Divergence?
Divergence is a technical analysis concept that highlights discrepancies between price movements and indicator readings. It acts as an early warning sign that the current trend may be weakening or reversing. There are two primary types of divergence:
1. Regular Divergence
Regular divergence signals a trend reversal. It occurs when price makes a higher high (or lower low) while the indicator makes a lower high (or higher low). For example:
- Bearish Regular Divergence: Price hits a new high, but the MACD histogram fails to reach a new peak. This suggests bullish momentum is fading, and a downward reversal is likely.
- Bullish Regular Divergence: Price makes a new low, but the RSI stays above its previous low. This indicates bearish pressure is easing, and an upward reversal may follow.
2. Hidden Divergence
Hidden divergence confirms a trend continuation. It happens when price makes a lower high (or higher low) while the indicator makes a higher high (or lower low). For instance:
- Bullish Hidden Divergence: Price forms a lower low, but the Stochastic oscillator makes a higher low (above 20). This means the downtrend is still strong, and a bounce is probable.
- Bearish Hidden Divergence: Price makes a higher high, but the CCI (Commodity Channel Index) makes a lower high (below +100). This signals the uptrend remains intact, and a pullback is likely.
Understanding these two types is critical—they dictate whether you should enter a reversal trade or a continuation trade.
Why Divergence Matters in Forex Trading
Divergence is a game-changer for several reasons:
- Early Warning Signals: Divergence often appears before major price reversals, allowing traders to enter positions early and maximize profits.
- Trend Confirmation: Hidden divergence validates that a trend is still strong, helping traders avoid false breakouts and stay in profitable trades longer.
- Risk Management: By identifying divergence, traders can place stop-loss orders more strategically, reducing the risk of large losses.
- Versatility: Divergence works across all timeframes—from intraday scalping to long-term investing—making it a flexible tool for any trader.
Key Indicators for Detecting Divergence
While divergence can be spotted on almost any indicator, some are more reliable due to their sensitivity to momentum shifts. Here are the top indicators used by forex traders:
1. MACD (Moving Average Convergence Divergence)
The MACD is one of the most widely used indicators for divergence trading. It consists of three components: the MACD line (12-period EMA minus 26-period EMA), the signal line (9-period EMA of the MACD line), and the histogram (difference between the MACD and signal lines).
- Bullish Divergence: Price makes a lower low, but the MACD histogram makes a higher low.
- Bearish Divergence: Price makes a higher high, but the MACD histogram makes a lower high.
2. RSI (Relative Strength Index)
The RSI measures overbought (70+) and oversold (30-) conditions. Divergence on the RSI is particularly useful for spotting reversals.
- Bullish Divergence: Price makes a lower low, but the RSI makes a higher low (stays above 30).
- Bearish Divergence: Price makes a higher high, but the RSI makes a lower high (stays below 70).
3. Stochastic Oscillator
The stochastic oscillator compares closing prices to a range over a period. It’s great for identifying momentum shifts.
- Bullish Divergence: Price makes a lower low, but the stochastic makes a higher low (above 20).
- Bearish Divergence: Price makes a higher high, but the stochastic makes a lower high (below 80).
4. CCI (Commodity Channel Index)
The CCI measures the deviation of price from its moving average. It’s sensitive to volatility and useful for spotting divergences in trending markets.
- Bullish Divergence: Price makes a lower low, but the CCI makes a higherlow (above -100).
- Bearish Divergence: Price makes a higher high, but the CCI makes a lower high (below +100).
Setting Up Divergence Indicators on MT4/MT5
Both MT4 and MT5 have similar interfaces, so the setup process is nearly identical. Here’s how to add and customize divergence indicators:
Step 1: Add an Indicator
- Open your chart (e.g., EUR/USD, 1-hour timeframe).
- Click on the Insert menu at the top.
- Select Indicators and choose your desired indicator (e.g., MACD, RSI).
- Adjust parameters (periods, levels) to your preference (default settings work well for most traders).
- Click OK to apply the indicator.
Step 2: Customize Your Chart
- Multiple Indicators: Add 1–2 key indicators (e.g., MACD + RSI) to the same chart for better divergence detection.
- Zoom: Use the zoom feature to focus on recent price action.
- Show Lines: Enable “Show Lines” for indicators to visualize divergence patterns clearly.
Example: Setting Up MACD on MT4
- Insert > Indicators > Oscillators > MACD.
- Set Fast EMA to 12, Slow EMA to 26, and Signal SMA to 9.
- Click OK. The MACD line, signal line, and histogram will appear below the price chart.
Pro Tip: Save your indicator setups as templates (File > Templates > Save Template) for quick access in future trades.
Setting Up Divergence Indicators on TradingView
TradingView is a web-based platform with advanced charting tools and community features. Here’s how to set up divergence indicators:
Step 1: Add an Indicator
- Open a chart (e.g., GBP/JPY, 4-hour timeframe).
- Click the Indicators button on the left sidebar.
- Search for your desired indicator (e.g., “MACD”) and select it.
- Adjust parameters (if needed) and click Add.
Unique Features of TradingView
- Pine Script: Create custom indicators or modify existing ones using Pine Script (great for advanced traders).
- Alerts: Set up alerts for divergence signals so you don’t miss opportunities.
- Sharing Charts: Share your charts with other traders to get feedback or ideas.
- Multiple Timeframes: Switch between timeframes easily to confirm divergence signals.
Example: Setting Up RSI on TradingView
- Click Indicators > Oscillators > RSI.
- Set Length to 14 (default) and Overbought/Oversold levels to 70/30.
- Click Add. The RSI line will appear below the price chart.
Pro Tip: Use the “Compare” feature to overlay multiple indicators (e.g., MACD + RSI) on the same chart for better divergence detection.
How to Trade with Divergence
Now that your indicators are set up, it’s time to learn how to trade with divergence. Follow this step-by-step process:
Step 1: Identify Divergence
Look for price action that moves in the opposite direction of your indicator. For example:
- If the EUR/USD is making higher highs, but the MACD histogram is making lower highs, that’s a bearish regular divergence.
Step 2: Confirm with Other Indicators
Never rely solely on divergence. Use other indicators (e.g., moving averages, support/resistance) to confirm the signal. For example:
- If you see a bearish divergence on the MACD, check if the price is below a key resistance level or if the 50-day EMA is sloping downward.
Step 3: Entry Rules
- Regular Divergence (Reversal): Enter a trade in the opposite direction of the trend.
- Bearish: Sell when the price breaks below the previous low.
- Bullish: Buy when the price breaks above the previous high.
- Hidden Divergence (Continuation): Enter a trade in the same direction as the trend.
- Bullish: Buy when the price breaks above the previous high.
- Bearish: Sell when the price breaks below the previous low.
Step 4: Stop-Loss Placement
Place your stop-loss beyond the recent swing high/low to avoid being stopped out prematurely. For example:
- If you’re selling on a bearish divergence, place the stop-loss above the recent high.
Step 5: Take-Profit Targets
Use Fibonacci retracement levels, support/resistance zones, or previous swing highs/lows to set take-profit targets. Aim for a 2:1 risk-to-reward ratio (e.g., 50-pip stop-loss = 100-pip take-profit).
Example Trade: Bearish Regular Divergence on EUR/USD
- Setup: EUR/USD is in an uptrend, making higher highs. The MACD histogram is making lower highs.
- Confirmation: Price approaches a key resistance level (1.1200), and the 50-day EMA is flattening.
- Entry: Sell when the price breaks below the previous low (1.1150).
- Stop-Loss: Place above the recent high (1.1180).
- Take-Profit: Target the next support level (1.1100), approximately 50 pips away.
Common Mistakes to Avoid When Trading Divergence
Even though divergence is a powerful tool, many traders make costly mistakes. Here are the most common pitfalls and how to avoid them:
- Ignoring Market Context: Divergence signals are more reliable in trending markets. If the market is ranging (sideways), divergence may give false signals. Always check the overall trend before trading.
- Over-Trading: Don’t jump into every divergence signal you see. Wait for confirmation and only trade when the setup meets your criteria.
- Poor Risk Management: Never risk more than 1–2% of your account per trade. Unexpected news can move the market against you, so proper risk management is non-negotiable.
- Using Too Many Indicators: Cluttered charts lead to confusion. Stick to 1–2 key indicators for divergence trading.
- Not Waiting for Confirmation: Divergence alone isn’t enough. Wait for price to break a key level (support/resistance) or for another indicator to confirm the signal.
- Trading Against the Trend: Regular divergence signals reversals, but if the overall trend is strong, it’s better to wait for a pullback rather than trading against the trend.
Tips for Success with Divergence Trading
To master divergence trading, follow these tips:
- Practice on Demo Accounts: Before risking real money, practice on a demo account. This will help you get familiar with the indicators and test your strategy.
- Combine with Other Strategies: Divergence works best when combined with other strategies, such as trend following or support/resistance trading.
- Stay Updated on News: Economic news (e.g., interest rate decisions, GDP reports) can override divergence signals. Check the economic calendar before trading.
- Keep a Trading Journal: Record your trades, including the setup, entry/exit points, and reasons for taking the trade. Review your journal regularly to identify patterns and improve your strategy.
- Be Patient: Divergence signals don’t occur frequently. Wait for high-probability setups rather than forcing trades.
- Adjust Settings for Different Timeframes: Shorter timeframes (e.g., 15-minute) may require faster indicators (e.g., 5-period RSI), while longer timeframes (e.g., daily) may need slower indicators (e.g., 14-period RSI).
Conclusion
Divergence is a valuable tool for forex traders looking to improve their timing and profitability. By understanding the difference between regular and hidden divergence, using reliable indicators, and following a structured trading plan, you can turn divergence signals into consistent gains. Remember to practice on demo accounts, avoid common mistakes, and stay disciplined. With time and effort, you’ll be able to master divergence trading and achieve your financial goals.
Whether you’re using MT4, MT5, or TradingView, the principles of divergence trading remain the same. Start small, be patient, and never stop learning.
Support & Disclaimer
Got questions or need help? Reach out anytime:
- WhatsApp: https://wa.me/+443300272265
- Telegram: https://t.me/yoforexrobot
Disclaimer: Past performance is no guarantee of future results. All trading carries risk. Always demo-test in a risk-free environment before deploying on a live account.
Comments (0)
No comments yet. Be the first to comment!
Leave a Comment