TARGET BANDS Indicator MQ4 for EURUSD (M30)
If you’ve been hunting for a clean, rules-driven way to trade EURUSD without the usual noise, the TARGET BANDS Indicator MQ4 might be your new favorite tool. It draws dynamic upper and lower bands around price—giving you a living, breathing map of where price tends to stretch and snap back, and when momentum is strong enough to break out. No clutter, no gimmicks. Just a visual guide that helps you time entries, frame risk, and avoid chasing candles. And yep, it’s built for MetaTrader 4 (MT4), so you can drop it on your charts in seconds and start testing right away.
This post focuses specifically on EURUSD, M30 timeframe. Why? Because M30 smooths out lower-timeframe noise while still being intraday-friendly; you get enough signals to stay engaged, but not so many that you’re glued to the screen. Plus, EURUSD’s tight spreads and consistent liquidity make band-based strategies shine. Let’s unpack how TARGET BANDS works, how to configure it, and a simple step-by-step playbook you can actually follow—coz trading shouldn’t feel like rocket science.
What is the TARGET BANDS Indicator?
At its core, TARGET BANDS is a volatility-adaptive channel overlay. Think of it like a cousin to Bollinger Bands, but tuned for more actionable intraday decision-making. The indicator calculates a central reference (often a moving average or smoothed baseline), then projects bands above and below using recent volatility. When price presses into the outer bands, it’s telling you one of two things:
-
the trend is strong and potentially continuing, or
-
price is stretched and a mean-reversion pullback is likely.
The trick—and where this indicator really helps—is distinguishing between those two states in real time. TARGET BANDS is optimized to show clean envelopes that don’t whip around with every micro tick. The result: clearer signals, fewer second-guesses.
Why EURUSD on M30?
EURUSD is the most traded pair on earth; spreads are usually razor-thin, and fills are consistent. That matters a lot when using a bands-based approach, because you’ll sometimes scale in or out on dynamic touches of the band. M30 gives you enough context to avoid the M1/M5 “fake flutters” while letting you catch London and NY session moves without holding for days. It’s a sweet spot for balanced signal frequency, especially if you’re blending trend continuation and mean reversion.
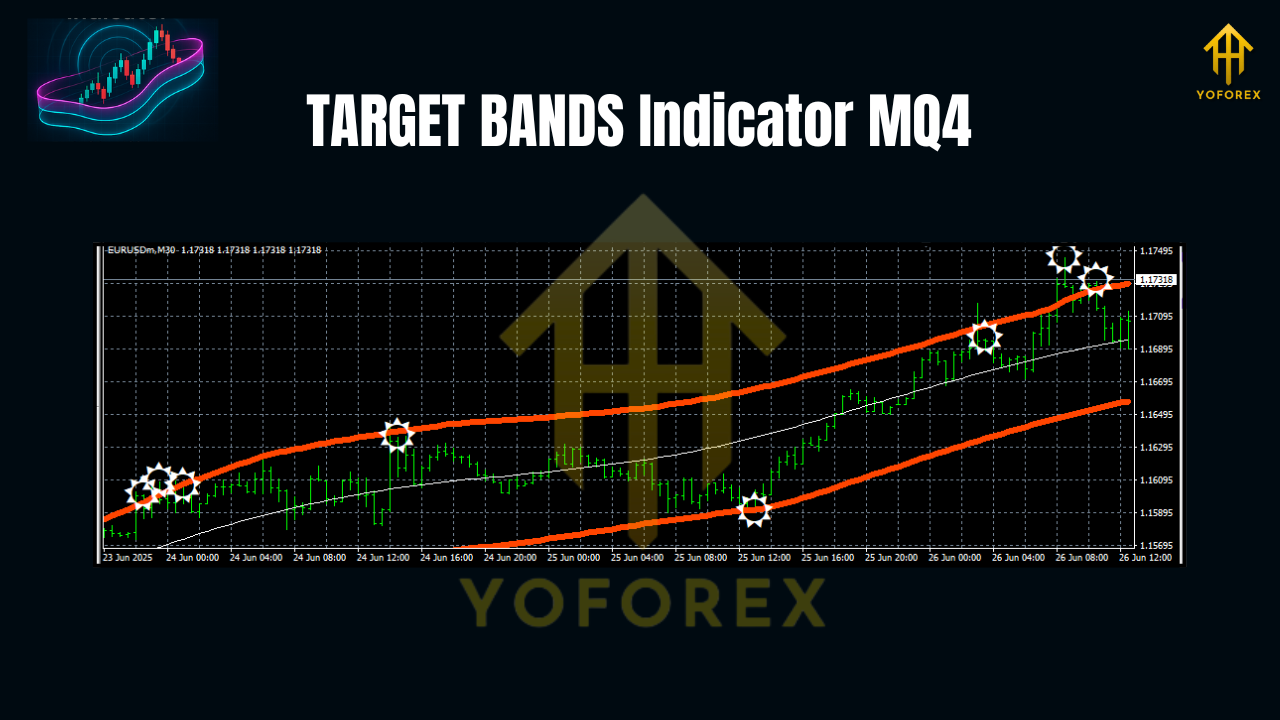
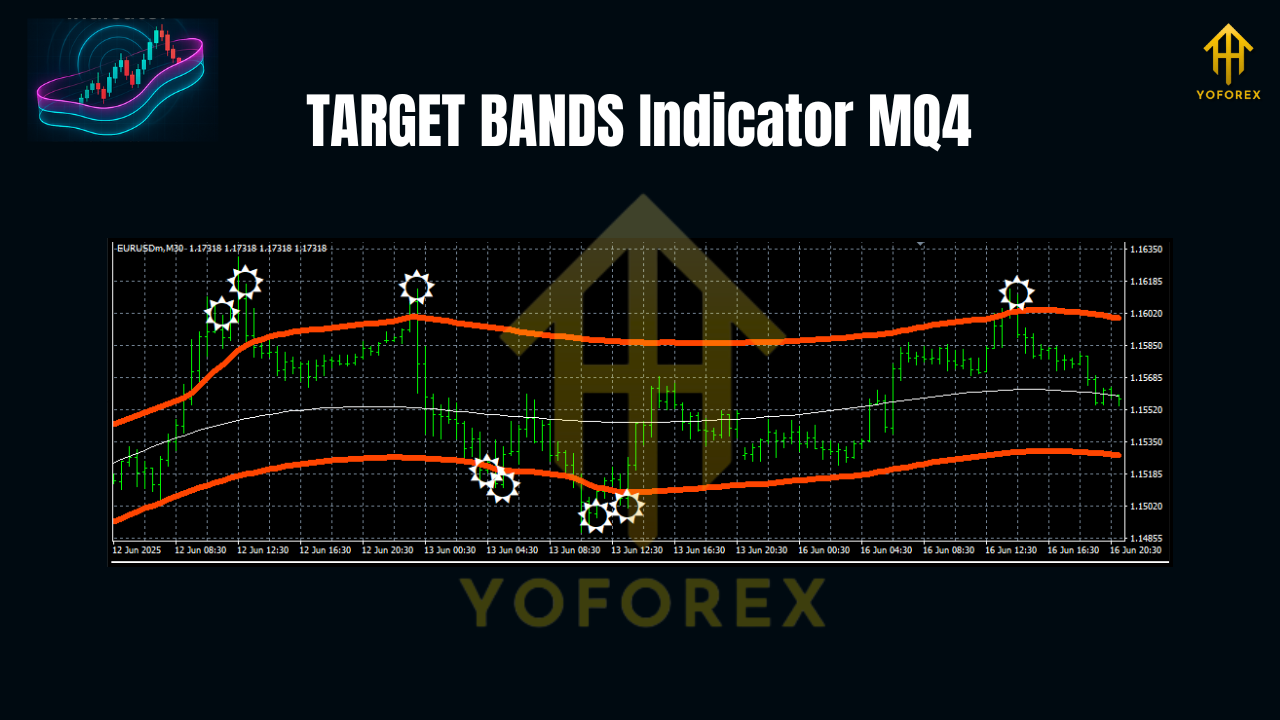
How TARGET BANDS Signals Play Out
Here’s how to read the canvas:
- Upper Band Touch + Momentum: If EURUSD closes above the midline and hugs or pierces the upper band with rising candle bodies (not just wicks), that’s often a trend-continuation context. You’re looking for shallow pullbacks toward the midline to enter long rather than blindly selling the touch.
- Lower Band Touch + Momentum: Mirror the logic for shorts. Sustained closes below the midline with repeated taps on the lower band hint that the path of least resistance is down. Pullbacks toward the midline = opportunities to join the move.
- Band Spike + Rejection Wick: When price stabs beyond an outer band and snaps back with a long wick, it’s a mean-reversion cue—especially if the prior move was extended and you see volume (if your broker feeds it) taper. This works beautifully during range-bound periods between major sessions or after a news burst fades.
- Band Squeeze → Expansion: When bands pinch tight (volatility compression), expect a directional expansion. The first strong close beyond the squeezed band often kicks off a breakout leg. Don’t pre-guess; wait for price to prove it with a decisive candle body close and follow-through.
A Simple, Repeatable Strategy (EURUSD, M30)
You don’t need twenty rules. Try this baseline playbook and refine from there:
Long (trend-continuation) Setup
- Bands are angled up; midline clearly rising.
- Price pulls back toward the midline after touching or riding the upper band.
- Enter long on a bullish M30 candle that closes back above the midline (or prints a higher low vs. prior pullback candle).
- Stop-loss: a few pips below the recent swing low or just below the lower band if you want a volatility-aligned stop.
- Take-profit: scale out at the upper band touch; leave a runner if momentum persists. Consider partials at 1R, then trail behind the midline.
Short (trend-continuation) Setup
- Bands angled down; midline falling.
- Price pulls back to the midline after tapping/riding the lower band.
- Enter short on a bearish M30 close back below the midline.
- Stop-loss: a few pips above the most recent swing high or slightly above the upper band.
- Take-profit: scale out on the lower band touch; trail the rest with the midline.
Mean-Reversion Add-On
- After an extended thrust, a pronounced wick piercing an outer band—followed by a close back inside the channel—can be faded toward the midline. Smaller size, tighter stops. Don’t fade strong news-driven moves during the first 30–60 minutes after release.
Recommended Settings (Starting Point)
Your build of TARGET BANDS may expose parameters like Period, Deviation/Multiplier, Smoothing, Applied Price, and Alert modes. For EURUSD M30, here’s a sensible starting template you can tweak:
- Period: 20–30 (try 24 as a middle ground)
- Multiplier/Deviation: 2.0 to 2.5 for balanced sensitivity (2.2 is a nice sweet spot)
- Smoothing: Light smoothing if your version supports it (EMA/SMA blend or simple EMA).
- Applied Price: Close (default).
- Alerts: Turn on band touch + midline cross alerts if your indicator supports notifications.
If the bands feel too jumpy, bump the period up or increase smoothing slightly. If they lag too much (signals arrive late), reduce the period or trim smoothing.
When to Trade (Session Tips)
- London Open to NY Lunch (approx. UTC 07:00–16:00) is prime for trend-continuation plays as liquidity and direction improve.
- The NY–London overlap can produce strong expansions; watch for band squeezes breaking into expansion.
- After-hours/Asian drift on EURUSD tends to be slower; mean-reversion to the midline often performs better than chasing a trend then.
Risk Management That Actually Sticks
This is the unsexy part, but it’s what separates consistent results from chaos:
- Risk per trade: 0.5%–1% is sane for most traders.
- Max daily loss: 2%–3% and walk away; don’t revenge-trade.
- No doubling down: If using mean-reversion, avoid averaging losers; TARGET BANDS is not a license for martingale, tho it can be tempting.
- News discipline: Step aside 10–15 minutes before high-impact USD/EUR events; let the initial whipsaws pass.
Common Mistakes (and Easy Fixes)
- Selling every upper-band touch: In strong trends, the upper band is a runway, not a ceiling. Confirm trend direction with the midline slope and structure (higher highs/lows).
- Ignoring context: A band squeeze right before London often precedes a breakout. Don’t fade everything because “it touched the band.”
- Stops too tight: Volatility breathes. If your stop sits exactly on the band, a normal nudge can tag you out. Give trades room relative to recent ATR or swings.
- Over-optimizing: Don’t chase the “perfect” period. Pick something reasonable, forward-test for a few weeks, and make incremental adjustments.
Example Play (Walkthrough)
Imagine EURUSD drifts sideways during late Asia, bands compressing on M30. London opens; a wide-body bullish candle closes above the upper band with the midline starting to curve up. You resist the urge to chase that candle. Instead, you wait for a modest pullback—two smaller candles into the midline—then take a long when price prints a bullish close back above the midline. Stop goes below the local swing low. You scale partial profits on the next upper-band kiss, then trail the runner behind the rising midline. If NY data hits and volatility spikes against you, your trailing logic takes you out with green on the board. Simple. Repeatable.
Backtesting & Forward-Testing Tips
- Data window: At least 3–6 months on M30 for multiple sessions and regimes.
- Conditions: Trend days, range days, news days—log how the system behaves in each.
- Metrics to track: Win rate, average R per trade, max drawdown, and time-in-trade.
- Small forward test: Move from demo to micro-lot live once the forward curve resembles your backtest curve. Consistency first; size later.
Final Thoughts
The TARGET BANDS Indicator MQ4 isn’t magic—nothing is—but it gives you a clear structure: buy strength on pullbacks when the trend is aligned, sell weakness on rallies when the slide is intact, and selectively fade exhaustion back to the midline when conditions are right. On EURUSD M30, that structure holds up day after day because the pair’s liquidity makes band behaviors more reliable. Keep it simple, stay patient, and let the bands guide your risk and expectations. Past performance isn’t a guarantee, obviously; always test thoroughly and trade responsibly.
Join our Telegram for the latest updates and support
Comments (0)
No comments yet. Be the first to comment!
Leave a Comment