
Snake Kelter Indicator V2.94 for MT4: Adaptive Channels for Cleaner Entries
If you’ve ever felt your charts get “noisy” right when you need clarity, you’re not alone. Volatility expands, candles stretch, and a simple moving-average crossover just can’t keep up. The Snake Kelter Indicator V2.94 for MT4 steps in here. Built around adaptive channel logic, it helps you separate signal from noise by showing where price is traveling relative to dynamic bands. In plain English: it tries to answer, “Are we trending, pulling back, or breaking out right now?”—without drowning you in clutter.
This post walks through how Snake Kelter works, practical setups, best practices, and configuration tips. By the end, you’ll know exactly how to drop it into your MetaTrader 4 workflow and avoid the usual false starts many traders suffer through.
What is the Snake Kelter Indicator?
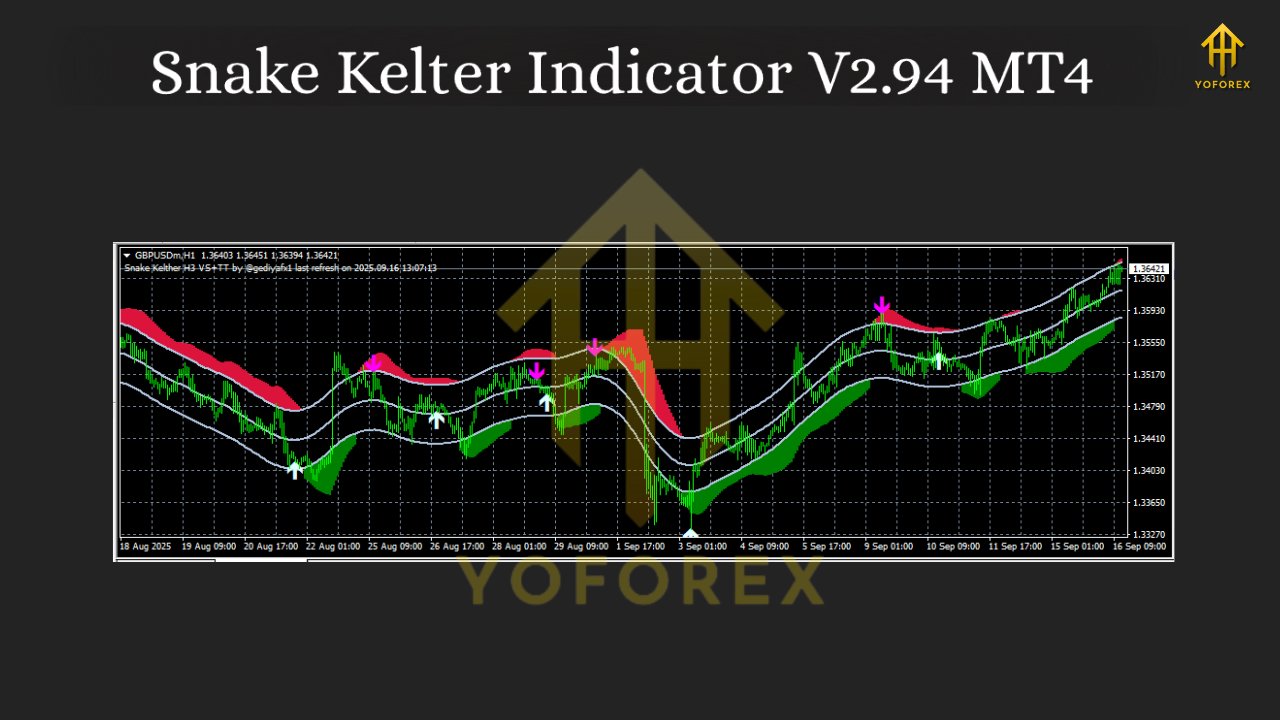
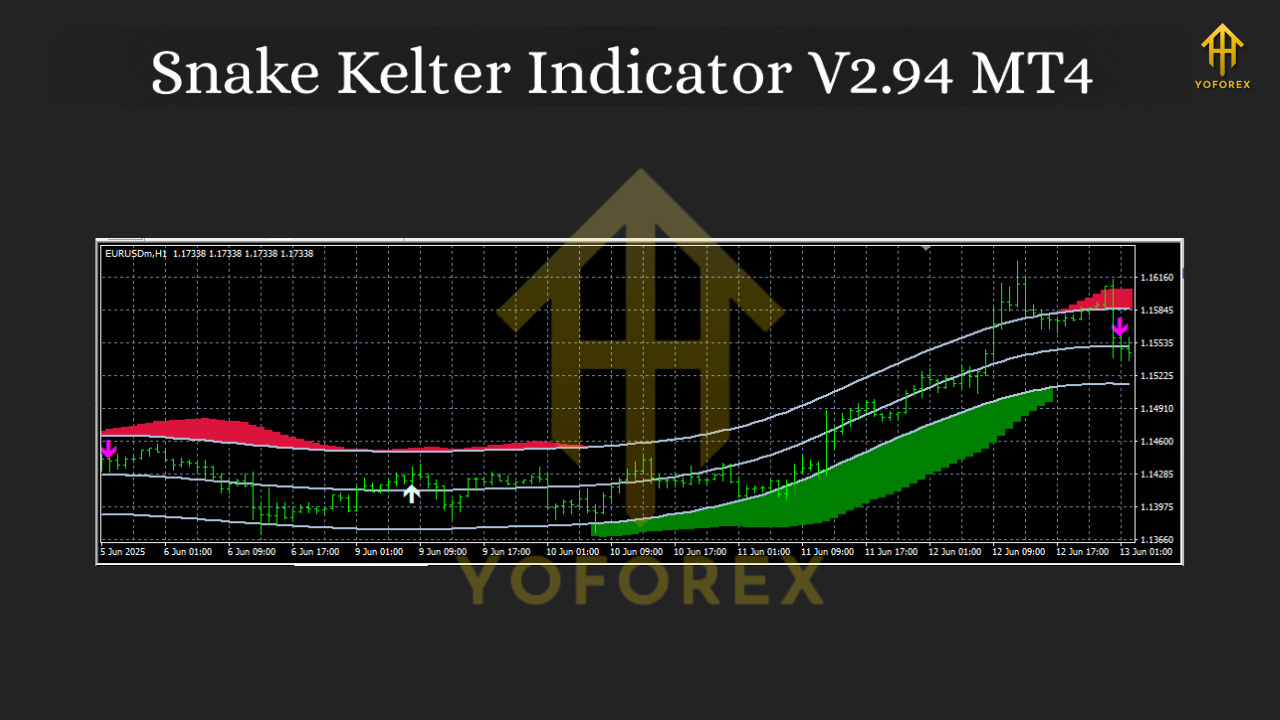
Snake Kelter V2.94 is a custom MT4 indicator that plots a central baseline with upper and lower envelopes that “breathe” with volatility. When price hugs the upper band and the channel is angled up, momentum is strong; when price compresses inside a flat channel, conditions are ranging and breakout traps are more likely. Think of it as a turbocharged channel overlay that adapts faster than a simple moving average and, crucially, tries to stay stable when markets get choppy.
Key objectives:
- Identify trend direction fast, while filtering random wiggles.
- Offer logical zones for entries (breakout or pullback) and exits (band tags, midline, or opposite band).
- Keep settings simple so you can tune responsiveness to your style—scalping, intraday, or swing.
It’s popular with traders who like visual structure. If you prefer a clean, low-discretion read—green light/red light style—Snake Kelter fits nicely, coz it translates volatility into an intuitive channel map you can actually act on.
How Snake Kelter V2.94 Works (in practice)
Under the hood, Snake Kelter calculates a midline (often a smoothed average) and builds dynamic bands around it using a volatility measure. As volatility rises, the bands expand; when markets calm down, the bands contract. This simple “breathing” effect helps:
- Trend recognition: An upward-sloping midline with price riding the upper band implies momentum continuation.
- Pullback detection: When price returns to the midline during an uptrend, you’ve got a structured area to stalk entries.
- Breakout context: Bands tightening and then expanding on a strong close beyond the envelope hints at a volatility breakout.
The V2.94 build focuses on smoothness (to reduce whipsaws) while still reacting quickly enough for modern markets. Traders can tweak sensitivity so the bands don’t overreact to single candles, especially around news.
Why Traders Like It (Key Benefits)
- Clarity at a glance: Channels show regime—trend vs range—without a pile of overlapping indicators.
- Actionable zones: Use upper/lower bands for profit targets or trailing; use midline for pullbacks.
- Flexible for any style: Works on M5 for scalps, H1/H4 for swings; gold, majors, indices—your call.
- Helps with discipline: Pre-defined areas curb revenge trades and FOMO entries.
- Alert-friendly: Set push/email/desktop alerts when price touches bands or the midline (if supported in your build).
Typical Use Cases and Setups
1) Trend Continuation (Break-and-Ride)
- Context: Midline angled up; price closes above the upper band after a tight channel phase.
- Entry: On a minor pullback that holds above the midline (or on the next bullish close if you prefer momentum).
- Stop: Below midline or below the opposite band, depending on risk appetite.
- Exit: Trail along the lower side of the channel in uptrends; scale out at prior swing highs.
2) Pullback to Midline (Buy the Dip / Sell the Rip)
- Context: Strong channel slope; price returns to the midline.
- Entry: Confirmation candle rejecting the midline.
- Stop: A few pips beyond the midline, or the opposite band for wider swings.
- Exit: First target at recent band touch, then trail.
3) Range Fade (Advanced)
- Context: Flat midline, tight channel, repeated band taps with no follow-through.
- Entry: Fade upper band (short) or lower band (long) with micro-confirmation.
- Stop: Just beyond the band; get out quick if a strong candle closes outside with follow-through.
- Exit: Midline, then opposite band.
- Note: Not for high-volatility news hours. Range fades can get steamrolled.
Best Timeframes, Pairs, and Sessions
- Timeframes:
- Scalpers: M5–M15, but keep spreads tight and execution fast.
- Intraday: M15–M30 for balanced noise vs responsiveness.
- Swing: H1–H4 for cleaner structure and fewer false breaks.
- Pairs/Markets:
- Majors (EURUSD, GBPUSD, USDJPY) for lower costs and smooth behavior.
- Gold (XAUUSD) for momentum lovers—tune sensitivity lower (slower) to avoid overreacting to spikes.
- Indices (US30, NAS100): Works, but widen stops and lower leverage; these move fast.
- Sessions:
- London & NY overlap for breakout/trend setups.
- Late NY/Asian for pullbacks and quieter mean-reversion plays (be selective).
Settings & Configuration Tips
Every broker feed and instrument behaves a bit differently. Use these as starting points—then forward-test on demo.
- Period / Lookback:
- 20–30 for intraday; 30–50 for swing. Higher values = smoother, fewer signals.
- Volatility Multiplier:
- 1.5–2.0 for majors; 2.0–2.5 for gold/indices to avoid whipsaws.
- Price Source:
- Typical price (H+L+C)/3 or close; pick whichever renders the smoothest channel for your market.
- Smoothing:
- Light smoothing on the midline keeps you from reacting to a single candle spike.
- Alerts (if your build includes them):
- Band cross, midline retest, slope change. Start with few alerts; expand later.
- Color/Width:
- Keep bands subtle, midline bold. Visual hierarchy improves decision speed.
Pro tip: Don’t overfit. If you find yourself curve-fitting a parameter to one week of gold, it’ll probably break next week. Aim for robust ranges that “feel right” across multiple pairs and months.
Risk Management That Actually Holds Up
- Risk per trade: 0.5–1.0% for intraday; 1–2% for swing.
- Position sizing: Base it on stop distance to the midline or the opposite band—don’t just slap on fixed lot sizes.
- News filter: The best channel in the world won’t save you from abnormal slippage during major releases.
- Daily loss cap: Stop after a fixed % drawdown (e.g., 3%). It keeps your edge intact for tomorrow.
Installation (MT4)
- Open MT4.
- Go to File → Open Data Folder.
- Navigate to MQL4 → Indicators.
- Paste the Snake Kelter V2.94
.ex4or.mq4file here. - Restart MT4 or refresh Navigator.
- Drag Snake Kelter V2.94 from Navigator → Indicators onto your chart.
- Adjust inputs (period, multiplier, smoothing, alerts) and click OK.
- Save a Template so you can load the setup on any symbol fast.
Common Mistakes to Avoid
- Chasing every band touch: Wait for context—slope, session, and candle structure.
- Ignoring spreads: On lower timeframes, a 2–3 pip spread can ruin a tight setup.
- Over-stacking indicators: Snake Kelter shines on clean charts. At most, add a simple RSI or volume.
- No exit plan: Pre-define target and stop before entry. The bands give you a blueprint—use it.
A Simple Trading Plan (you can test today)
- Market: EURUSD, M15
- Settings: Period 30, Multiplier 1.8, Typical Price, light smoothing
- Rules:
- Trade only when the midline has a noticeable slope.
- Long on pullback to midline in an uptrend with a bullish confirmation candle.
- Stop 1–2 ATR below the midline.
- Target 1: Recent upper band tag or last swing high.
- Target 2: Trail along the lower band offset.
- Stand aside during major red-flag news.
Run this in demo for two weeks. Record screenshots, entries/exits, and thoughts; you’ll quickly see where your personal tweaks should go.
Final Thoughts
Snake Kelter Indicator V2.94 for MT4 gives you structure in a world of randomness. It won’t predict the future, but it does provide a consistent lens to read price behavior—trend, pullback, breakout—so you can stop guessing and start executing with a plan. Keep it simple, keep risk small, and let the channel do the heavy lifting.
YoForex—empowering traders worldwide, one free tool at a time.


Comments (0)
No comments yet. Be the first to comment!
Leave a Comment