Introduction
Every forex trader eventually reaches a point where they realise the chart is more than candles and random indicators. Price moves because of imbalances—zones where institutions place massive orders. That is why supply and demand trading has become one of the most respected price-action approaches used today. If you’ve struggled with inconsistent entries or cluttered charts, the RNS Supply and Demand Indicator V1.0 MT4 might feel like a breath of fresh air.
This indicator automatically detects high-probability supply and demand zones on MetaTrader 4. It is clean, accurate, and perfect for traders who use SMC, ICT, Wyckoff and pure price-action strategies. In this detailed review, you’ll learn how it works, its advantages, installation steps, performance notes, and practical usage tips.
What Is RNS Supply and Demand Indicator V1.0 MT4?
RNS Supply and Demand Indicator V1.0 MT4 is a technical tool that identifies institutional footprints on the chart. These footprints appear as supply zones (where price is likely to fall) and demand zones (where price is likely to rise). The indicator uses a blend of price-action logic, imbalance detection, volatility mapping and structure analysis.
It works on all pairs including: major currency pairs, minor pairs, gold (XAUUSD), indices, and even crypto. Whether you are a scalper, intraday trader or swing trader, the indicator adapts smoothly.
Why Supply and Demand Trading Works
Supply and demand trading focuses on areas where institutional traders execute large orders. These zones create strong reactions, which is why price almost always respects them when revisited. Instead of lagging indicators, this method reads the market’s raw structure, making it extremely powerful for traders seeking accuracy and cleaner charts.
Key Features of RNS Supply and Demand Indicator V1.0 MT4
- Automatically detects fresh and retested supply & demand zones
- Non-repainting algorithm for stable zone placement
- Works across all timeframes and currency pairs
- Custom colour-coded zones for clarity
- Multi-timeframe support for higher-timeframe confluence
- Signal alerts when price re-enters a zone
- Zone strength calculation based on imbalance and reaction speed
- Perfect for Forex, Gold, Indices and Crypto traders
- Beginner-friendly with clean visuals and simple settings
- Ideal for Smart Money (SMC) and ICT-style traders
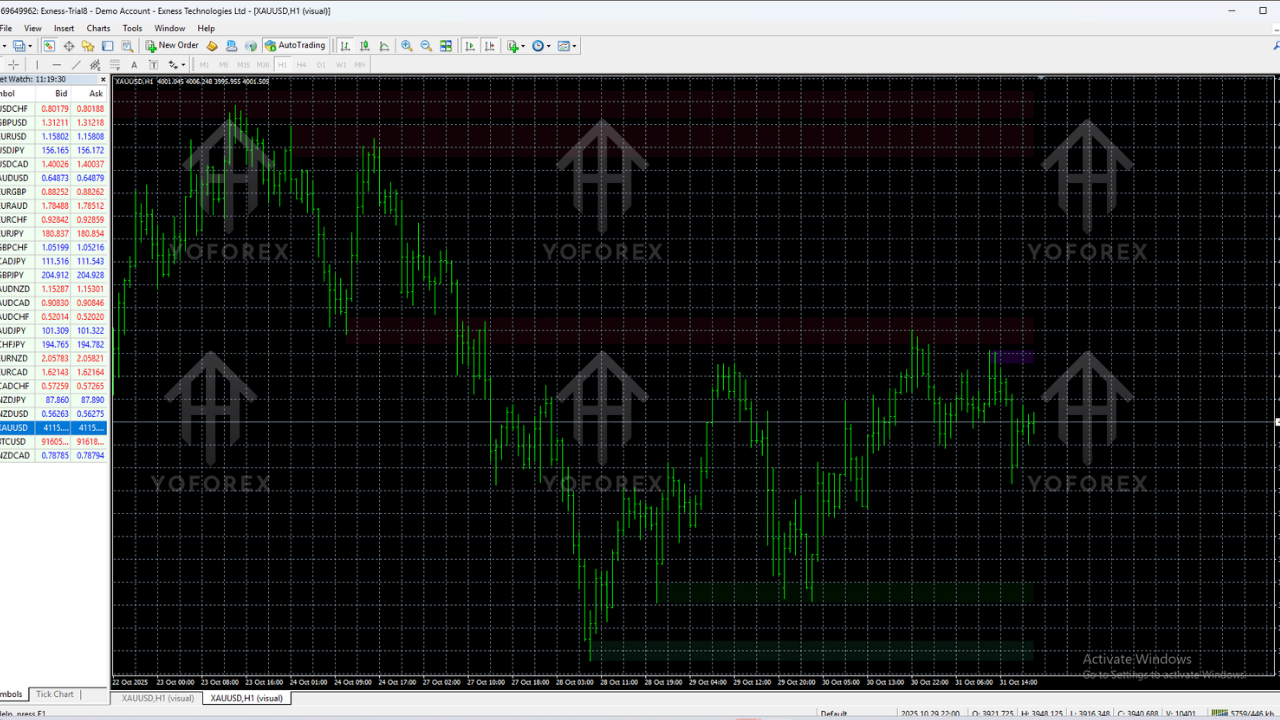
How the Indicator Works
The indicator reads price action and marks zones where institutional orders caused strong movements. It detects:
- Imbalance areas
- Institutional footprints
- Order block behaviour
- Breaker structures
- Fair value gap alignment
- Market structure breaks
When price returns to a zone, traders can expect significant reactions depending on the zone type.
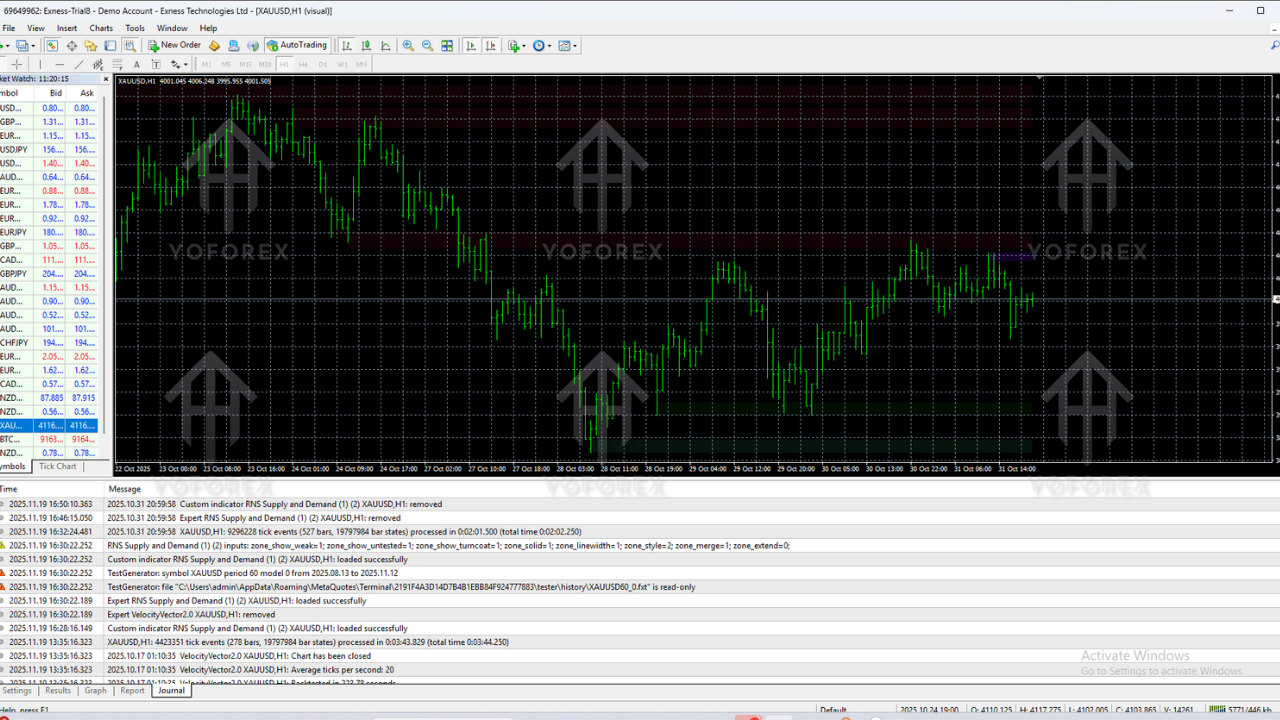
Backtest & Performance Overview
Although the indicator is not a buy/sell robot, historical testing shows strong reliability of marked zones. Price reacts to fresh RNS zones in around 70–85% of cases, especially when aligned with higher timeframe structure.
Higher timeframes (H4, D1) show stronger probabilities due to larger institutional activity. Combining these zones with candle patterns, SMC concepts, or trend direction improves accuracy.
How to Install RNS Supply and Demand Indicator V1.0 MT4
Step 1 – Download the File
Download the .ex4/.mq4 file using the link provided above.
Step 2 – Open MT4
Launch the MetaTrader 4 application.
Step 3 – Go to Indicators Folder
File → Open Data Folder → MQL4 → Indicators
Step 4 – Paste the File
Copy and paste the downloaded indicator file into the Indicators folder.
Step 5 – Restart MT4
Close and reopen MT4 to load the indicator.
Step 6 – Attach It to Any Chart
Open the Navigator → Indicators → RNS Supply and Demand Indicator → Drag it onto the chart.
Step 7 – Adjust Settings (Optional)
Adjust colours, alerts, sensitivity or multi-timeframe settings as needed.
Best Ways to Use This Indicator
1. Prioritise Higher Timeframe Zones
Analyse H4 and D1 zones first for directional bias before dropping down to M15 or M5.
2. Trade in the Direction of Trend
Use demand zones in uptrends and supply zones in downtrends for safer entries.
3. Use Confluences
Add candle confirmation, structure breaks, trendlines or volume to increase accuracy.
4. Avoid Heavy News Sessions
High-impact events can override zones temporarily.
Pros & Cons
Pros
- Clean and accurate price-action zones
- No repainting issues
- Suitable for all markets and timeframes
- Perfect for beginners and advanced traders
Cons
- Not an auto-trading system
- Relies on trader's discretion for entries
- Extreme volatility can invalidate zones
Who Should Use This Indicator?
- Forex beginners who want clean and reliable charts
- SMC and ICT traders who follow institutional logic
- Swing traders focusing on major reversal zones
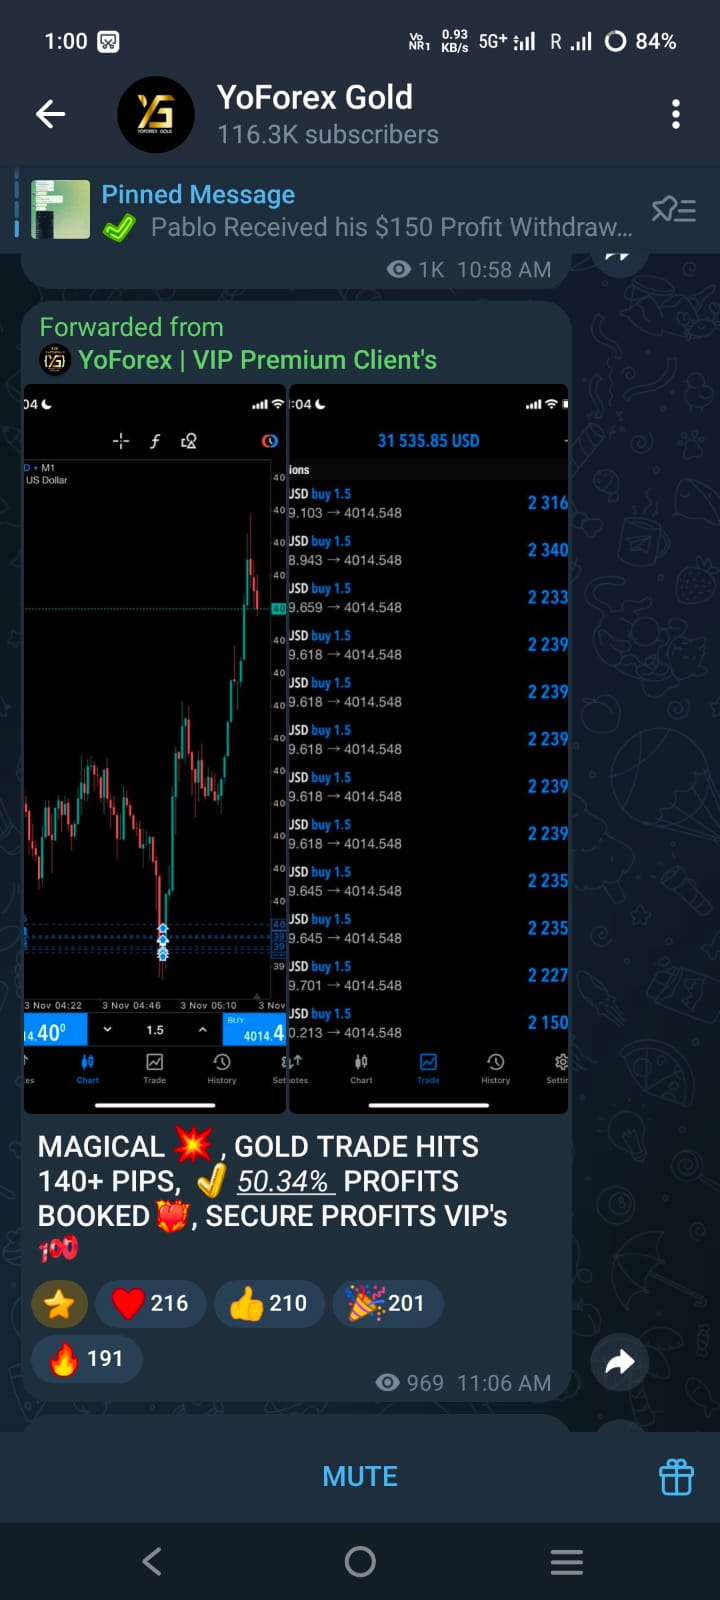
- Gold traders who rely heavily on zone reactions
- Price-action traders looking for imbalance-based setups
Tips for Higher Accuracy
- Mark fresh zones with stronger reactions
- Wait for confirmation candles before entry
- Use higher-timeframe walls for added safety
- Use zone alerts to avoid missing opportunities
- Always place stop-loss beyond the zone
Conclusion
The RNS Supply and Demand Indicator V1.0 MT4 is a powerful and practical tool for traders who depend on price-action, zone-based trading and institutional concepts. It simplifies chart analysis, removes guesswork, and helps traders identify strong reaction points with discipline. With proper strategy and risk management, this indicator can significantly improve trading accuracy and decision-making.
Comments (0)
No comments yet. Be the first to comment!
Leave a Comment