
If you trade with MetaTrader 4 and rely on alerts to time entries, MnF Forex Signals Indicator V1.0 for MT4 can serve as the visual cue that turns analysis into action. The challenge with any signals tool is not the arrow itself; it is how you convert that alert into a repeatable trade plan with strict risk, clear exits, and objective validation. This guide is written for traders who want a step-by-step process to install, configure, test, and deploy MnF on a live workflow without hype or guesswork.
What this indicator is—and is not
MnF Forex Signals Indicator V1.0 overlays buy/sell prompts on your MT4 charts and can trigger notifications when conditions are met. It is not a fully automated strategy. The edge you extract depends on your rules around context filtering, entries, stops, and exits. Expect the indicator to do one job well—timing—while you supply the structure around it.
Installation and first run (MT4)
- Place the indicator file in
MQL4/Indicators/and restart MT4. - Open a clean chart of EURUSD M15 to begin.
- Attach the indicator and keep “Allow DLL imports” off unless clearly required.
- If the input list offers it, set alerts to trigger on bar close rather than intrabar.
- Save a baseline template that includes price candles, the indicator, a 50 and 200 EMA, and ATR(14) for volatility.
This starter layout gives you trend, momentum, and volatility context around each signal so that arrows never float without meaning.
Recommended markets and timeframes
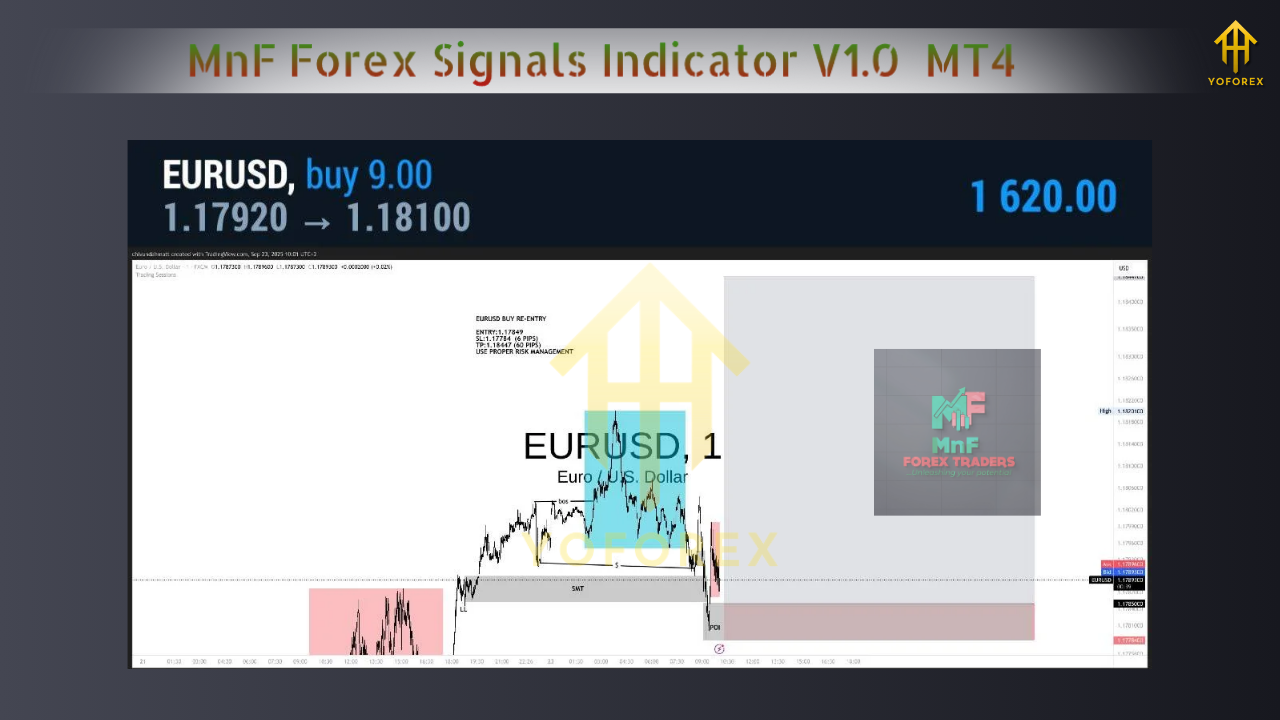
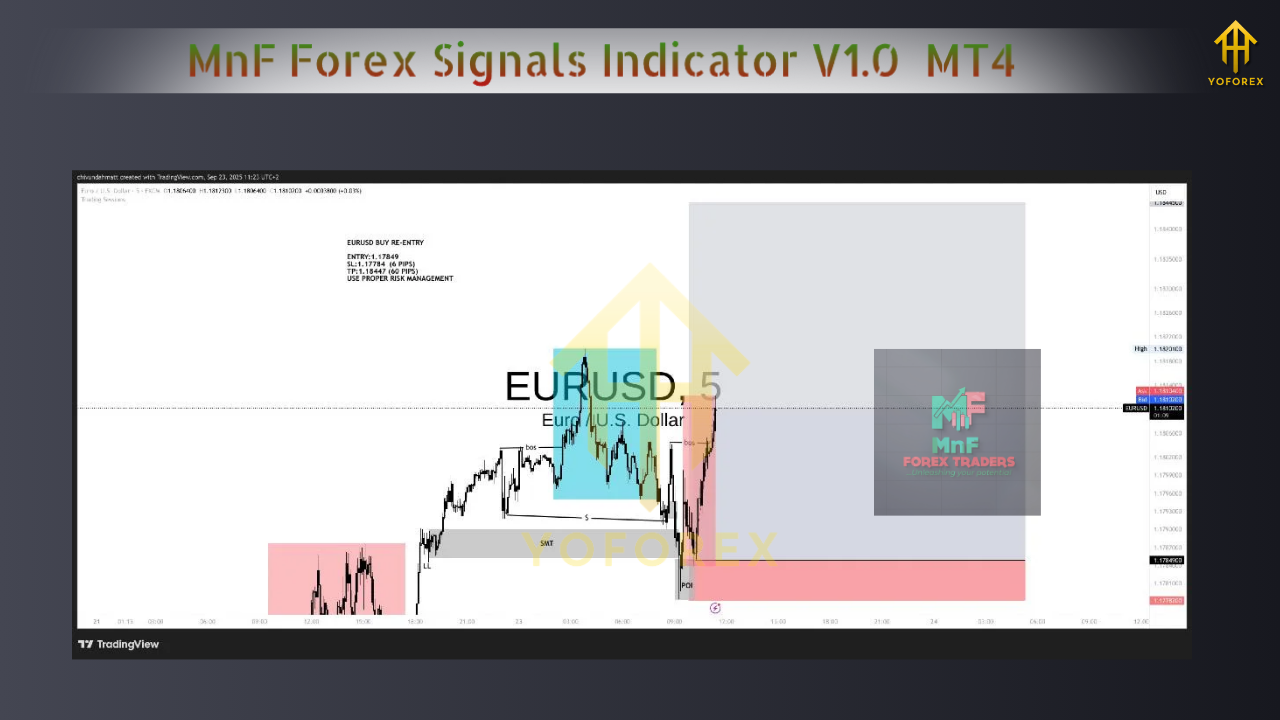
Begin on liquid majors—EURUSD, GBPUSD, USDJPY—where spreads are consistent and behavior is well studied. The sweet spot for many alert tools is M15 and H1. M15 delivers more samples for testing; H1 smooths noise and reduces overtrading. Once you have statistics, you can branch to gold or other assets with separate validation.
A complete trading framework built around MnF
Use the indicator only when a larger context agrees. Below is a concrete, testable ruleset you can apply for several weeks without changing mid-stream.
Context filter (trend and structure)
- Uptrend bias when EMA50 > EMA200; downtrend bias when EMA50 < EMA200.
- Trade only in the direction of the bias: longs during uptrend; shorts during downtrend.
- Optional structure rule: require a higher-high pullback in uptrends (or lower-low pullback in downtrends) before acting on a new arrow.
Entry confirmation (bar-close logic)
- Long: an MnF buy signal appears and the candle closes above EMA50.
- Short: an MnF sell signal appears and the candle closes below EMA50.
- Avoid very quiet periods by requiring ATR(14) ≥ 75% of its 6-month median on the current timeframe.
Stop-loss and position sizing
- Initial SL placed at the technical invalidation: either below/above the recent swing or at ATR(14) × 1.5 from entry, whichever is greater.
- Risk per trade fixed at 0.5%–1.0% of account equity. Lot size must be calculated from SL distance so your risk remains constant regardless of volatility.
Exit logic (choose one and stick to it for testing)
- Fixed-R model: take profit at 2.0R; move SL to breakeven once trade reaches +1.0R.
- Partial + trail: close 50% at 1.5R and trail the remainder with a close below/above EMA50 or a volatility trail of ATR(14) × 1.0.
- Session timeout: if neither SL nor TP hits by the end of the active session, exit at market to free margin and reset focus.
Trade management guardrails
- Maximum two open positions per symbol.
- Hard stop on new entries during major high-impact news for that symbol.
- If daily realized loss reaches −2R, stop trading for the day.
Backtesting that actually proves something
The most common mistake with signals tools is judging by screenshots or by intrabar arrows that later vanish. You can avoid that by testing correctly.
Step 1: Visual backtest in Strategy Tester
- Use “Every tick” for the model, run a 6–9 month window for each symbol/timeframe.
- Verify that arrows do not move on closed bars. Change timeframes forward and backward to confirm stability.
Step 2: Log every trade in R
- Record symbol, timeframe, date/time, entry price, SL price, R target, exit result in R, and notes on market context.
- After at least 80–120 trades across symbols, compute win rate, average R, profit factor, max drawdown, consecutive losses, and monthly net R.
Step 3: Forward testing on demo
- Run the exact same rules live for 2–4 weeks.
- Forward results should rhyme with backtest statistics. If they don’t, look at spread, slippage, execution time, or a tendency to chase marginal signals that looked better in hindsight.
What “good enough” looks like
- Profit factor ≥ 1.2 in initial tests and improving with small tweaks.
- Max drawdown ≤ 20% for the test horizon.
- Trade frequency of 8–15 qualified trades per month per pair on M15/H1 so you gather evidence without overtrading.
Settings to try first
Not every build exposes identical inputs, but the following defaults are balanced for discovery:
- Sensitivity: medium.
- Alerts: bar close only.
- Trend filter: enabled; work with EMA logic described above.
- Session filter: enabled; focus on London and New York hours for the highest quality moves.
- Visual elements: arrows and minimal labels; keep charts readable.
Save these as a .set file so you can repeat tests across symbols and timeframes with no drift.
Risk and psychology
No indicator can overcome poor risk control or emotional execution. Commit to fixed-fractional risk, respect your daily loss limit, and avoid meta-changes while testing. If you hit a drawdown larger than expected, cut risk in half until your equity recovers. Do not widen stops after entry; change the rules only after you complete a full testing cycle.
Troubleshooting checklist
- Too many false starts: raise ATR threshold or require a stronger pullback into EMA50 before entries.
- Good direction, poor exits: test the partial-take + EMA50 trail variant.
- Chop during Asia session: restrict trading windows to London/NY or require a higher ATR.
- Arrows look perfect on history: confirm bar-close alerts and retest; if closed-bar signals still shift, treat with caution and reduce reliance.
Frequently asked questions
Does MnF repaint?
You must test it. Use closed-bar alerts and refresh charts to confirm arrows are stable after each candle closes. If they move, reduce reliance on intrabar behavior and only act on closed bars.
Which timeframe is best?
Start with M15 and H1. If you prefer fewer decisions and smoother context, bias toward H1. Validate first before expanding.
Can I trade gold with it?
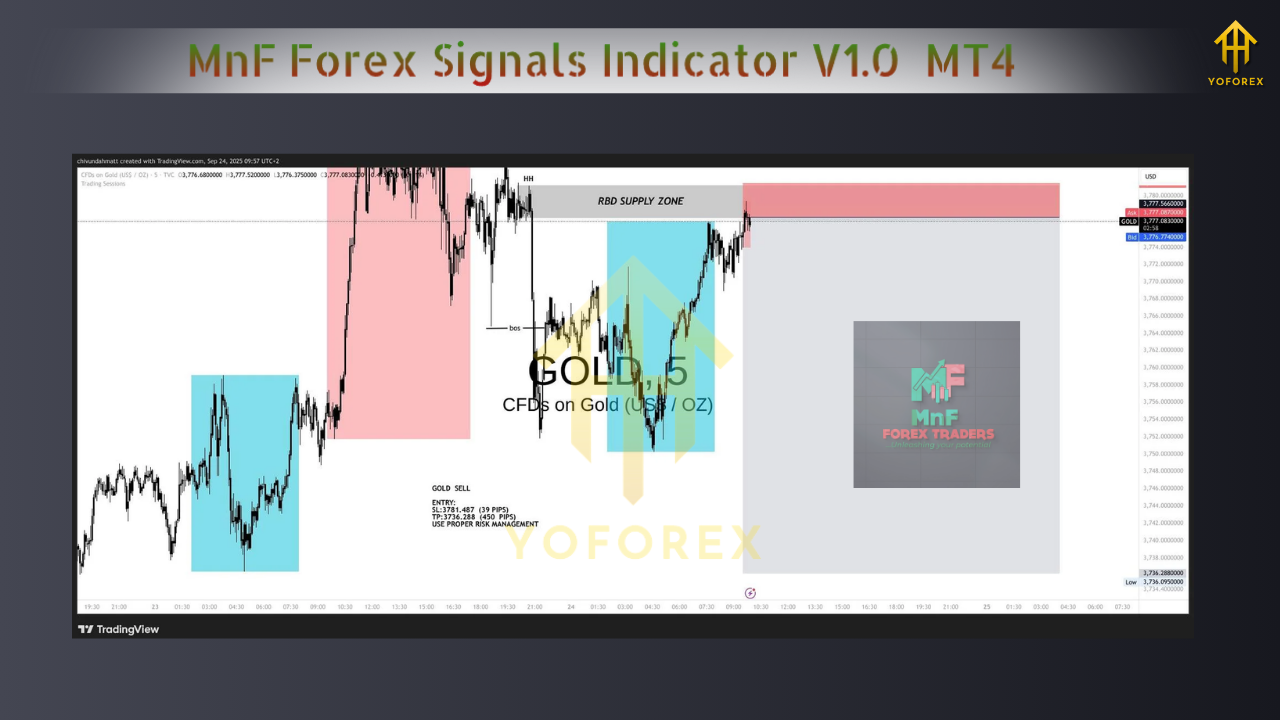
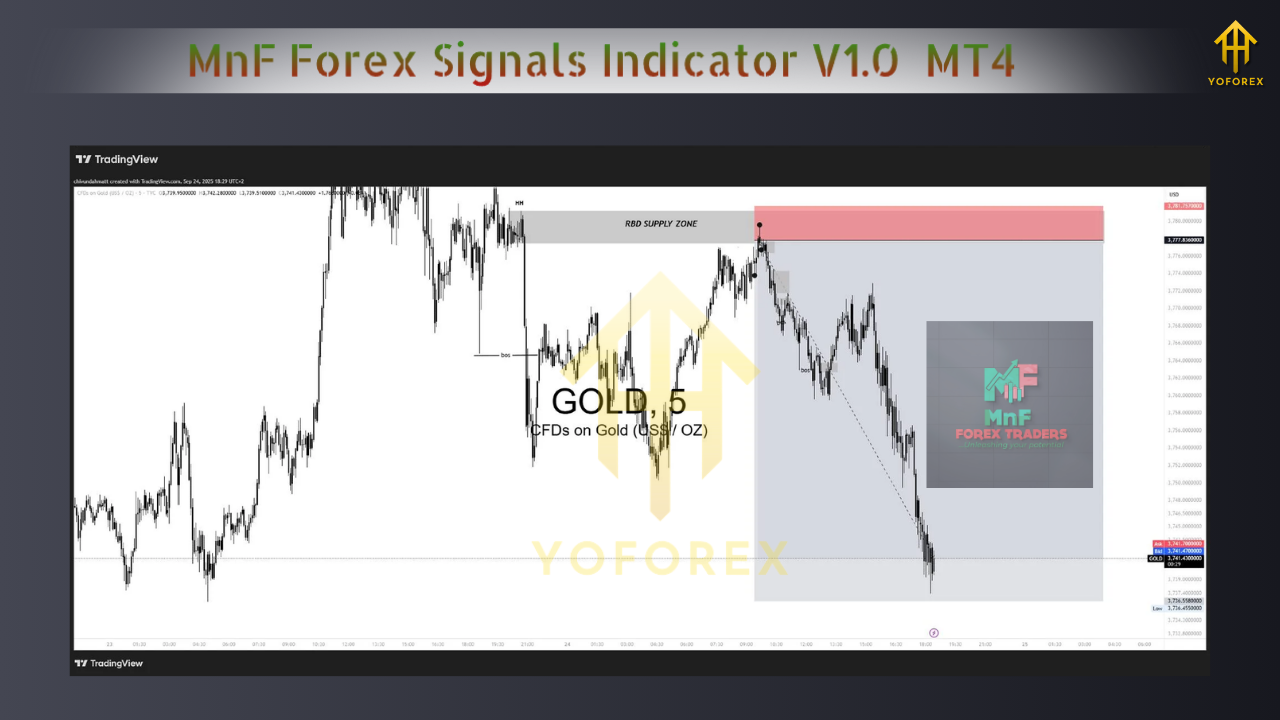
Yes, but gold’s volatility means wider stops and more variance. Validate on XAUUSD separately with ATR-based sizing and clear session rules.
What win rate is required?
With a 2.0R target and consistent rules, a 45–55% win rate is enough for profitability. Focus on execution quality and sample size rather than trying to optimize for an unrealistic hit rate.
The take-home
MnF Forex Signals Indicator V1.0 MT4 can provide a clean timing layer. To turn that layer into results, you need a robust context filter, firm risk policy, evidence from both backtesting and forward testing, and the discipline to run one ruleset long enough to trust the numbers. Treat this guide as your blueprint: install cleanly, start with majors on M15/H1, enforce bar-close confirmations, log in R, and iterate only after completing a full test cycle.
Comments (0)
No comments yet. Be the first to comment!
Leave a Comment