Introduction
In the intricate world of forex trading, identifying key price levels can make the difference between profit and loss. The Support and Resistance TLB OC v02 Indicator for MetaTrader 4 (MT4) is a powerful tool designed to help traders pinpoint critical support and resistance zones with precision. Known for its reliability and versatility, this indicator leverages the Three Line Break (TLB) charting technique to plot dynamic levels, offering traders clear visual cues for trade entries and exits. Whether you're a beginner learning the ropes or a seasoned trader refining your strategy, the TLB OC v02 is a must-have for enhancing decision-making in 2025’s volatile markets. This blog explores how the indicator works, its unique benefits, why it’s a top choice, and the best strategies to leverage its capabilities.
How It Works
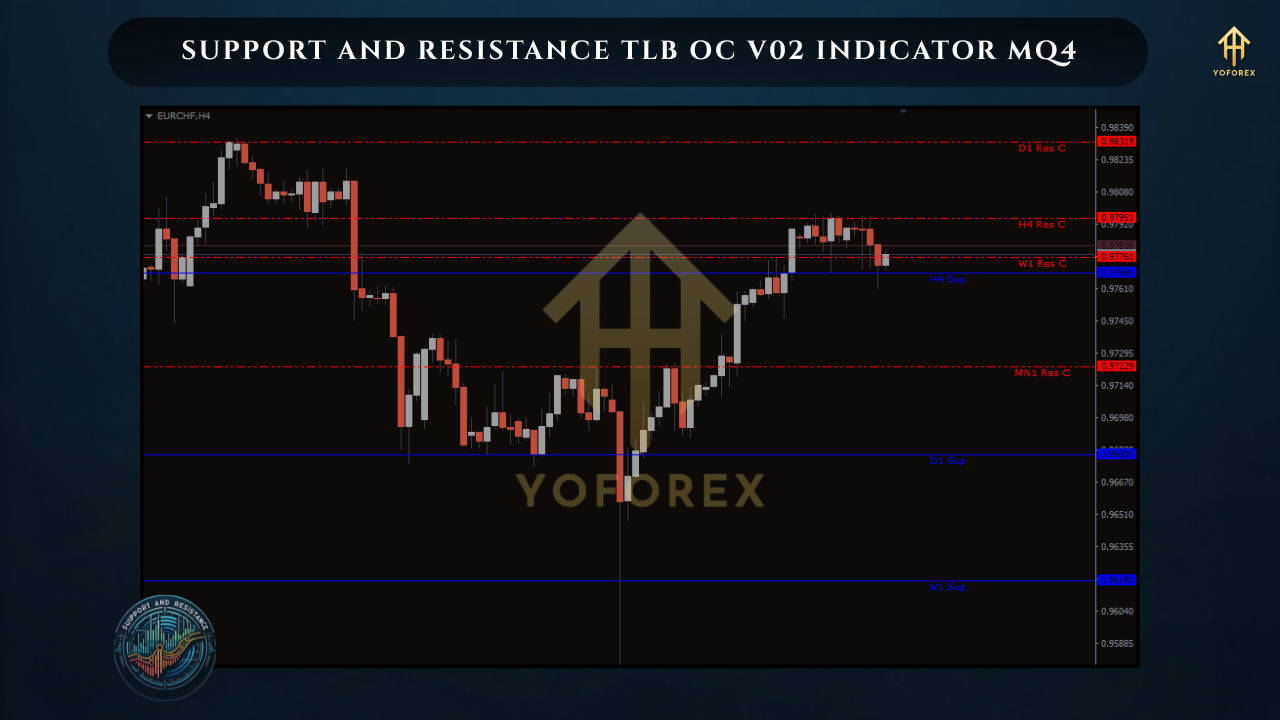
The Support and Resistance TLB OC v02 Indicator is an MT4 tool that automatically plots support and resistance levels based on the Three Line Break charting method, which focuses on price movements rather than time intervals. Unlike traditional indicators that rely on fixed pivot points, TLB OC v02 dynamically adjusts to market conditions, drawing horizontal lines at significant price levels where reversals or consolidations are likely. The indicator, available in both .mq4 (source code) and .ex4 (compiled) formats, can be easily installed by extracting the downloaded file, navigating to MT4’s “File” menu, opening the “Mql4” folder, and pasting the files into the “Indicators” folder before restarting the platform.
The indicator uses a lookback period (often denoted as “LB” in settings) to analyze historical price data, identifying swing highs and lows to establish support and resistance zones. It typically plots lines on the candle’s closing price rather than the wick’s extremes, providing a cleaner view of trend reversals. Compatible with all currency pairs and timeframes, from M1 to D1, it’s particularly effective on higher timeframes like H1 or H4 for reducing noise. Traders can customize parameters, such as line styles or the lookback period, to suit their trading style. Its multi-timeframe (MTF) capability allows users to view higher timeframe levels on lower timeframe charts, enhancing market context for scalping or swing trading.
Why Choose Support and Resistance TLB OC v02
The TLB OC v02 Indicator stands out for its accuracy and adaptability in identifying key price levels. Unlike many support and resistance indicators, it avoids clutter by focusing on significant zones, making it easier to spot high-probability setups. Its Three Line Break foundation ensures that levels are drawn based on meaningful price action, not arbitrary calculations, which aligns well with strategies rooted in price behavior. The indicator’s open-source .mq4 file allows advanced traders to modify its code, adding features like alerts for new levels or integrating it into Expert Advisors (EAs) for automated trading.
Its versatility across timeframes and pairs makes it suitable for diverse trading styles, from day trading to long-term investing. The indicator’s simplicity—requiring minimal setup—benefits beginners, while its MTF analysis and customization options appeal to professionals. Community feedback highlights its effectiveness, with traders noting its precision in binary options and forex scalping. Additionally, its free availability on platforms like Forex Factory and Forex Station ensures accessibility, with no hidden costs for updates or usage. For traders seeking a reliable, non-repainting indicator to complement their strategy, TLB OC v02 is a proven choice in 2025’s competitive forex landscape.
Best Strategy for Success
To maximize the Support and Resistance TLB OC v02 Indicator’s potential, traders should adopt a disciplined strategy tailored to its strengths. Start by installing the indicator on a demo account and testing it on your preferred pair, such as EUR/USD, on the H1 timeframe. Adjust the lookback period (e.g., LB=20) to balance sensitivity and reliability, ensuring levels capture significant swing points without excessive noise. Combine the indicator with price action analysis, entering trades when price rejects or breaks a level, confirmed by candlestick patterns like pin bars or engulfing candles. For breakout strategies, wait for a strong close beyond a resistance level with increased volume to confirm momentum.

Use the MTF feature to align trades with higher timeframe levels, such as H4 or D1, for greater confluence. For example, a buy signal on M15 is stronger if it coincides with an H4 support level. Avoid trading during high-impact news events, as volatility can lead to false breakouts. Set stop-loss orders just below support (for buys) or above resistance (for sells) to manage risk, aiming for a risk-reward ratio of at least 1:2. Backtest the indicator using MT4’s Strategy Tester with real tick data to optimize settings for your broker’s conditions. Regularly review performance, adjusting the lookback period or timeframe based on market trends. Joining forex forums like Forex Factory for community insights can further refine your approach. By integrating these practices, traders can harness the TLB OC v02 for consistent, profitable results.
Comments (0)
No comments yet. Be the first to comment!
Leave a Comment