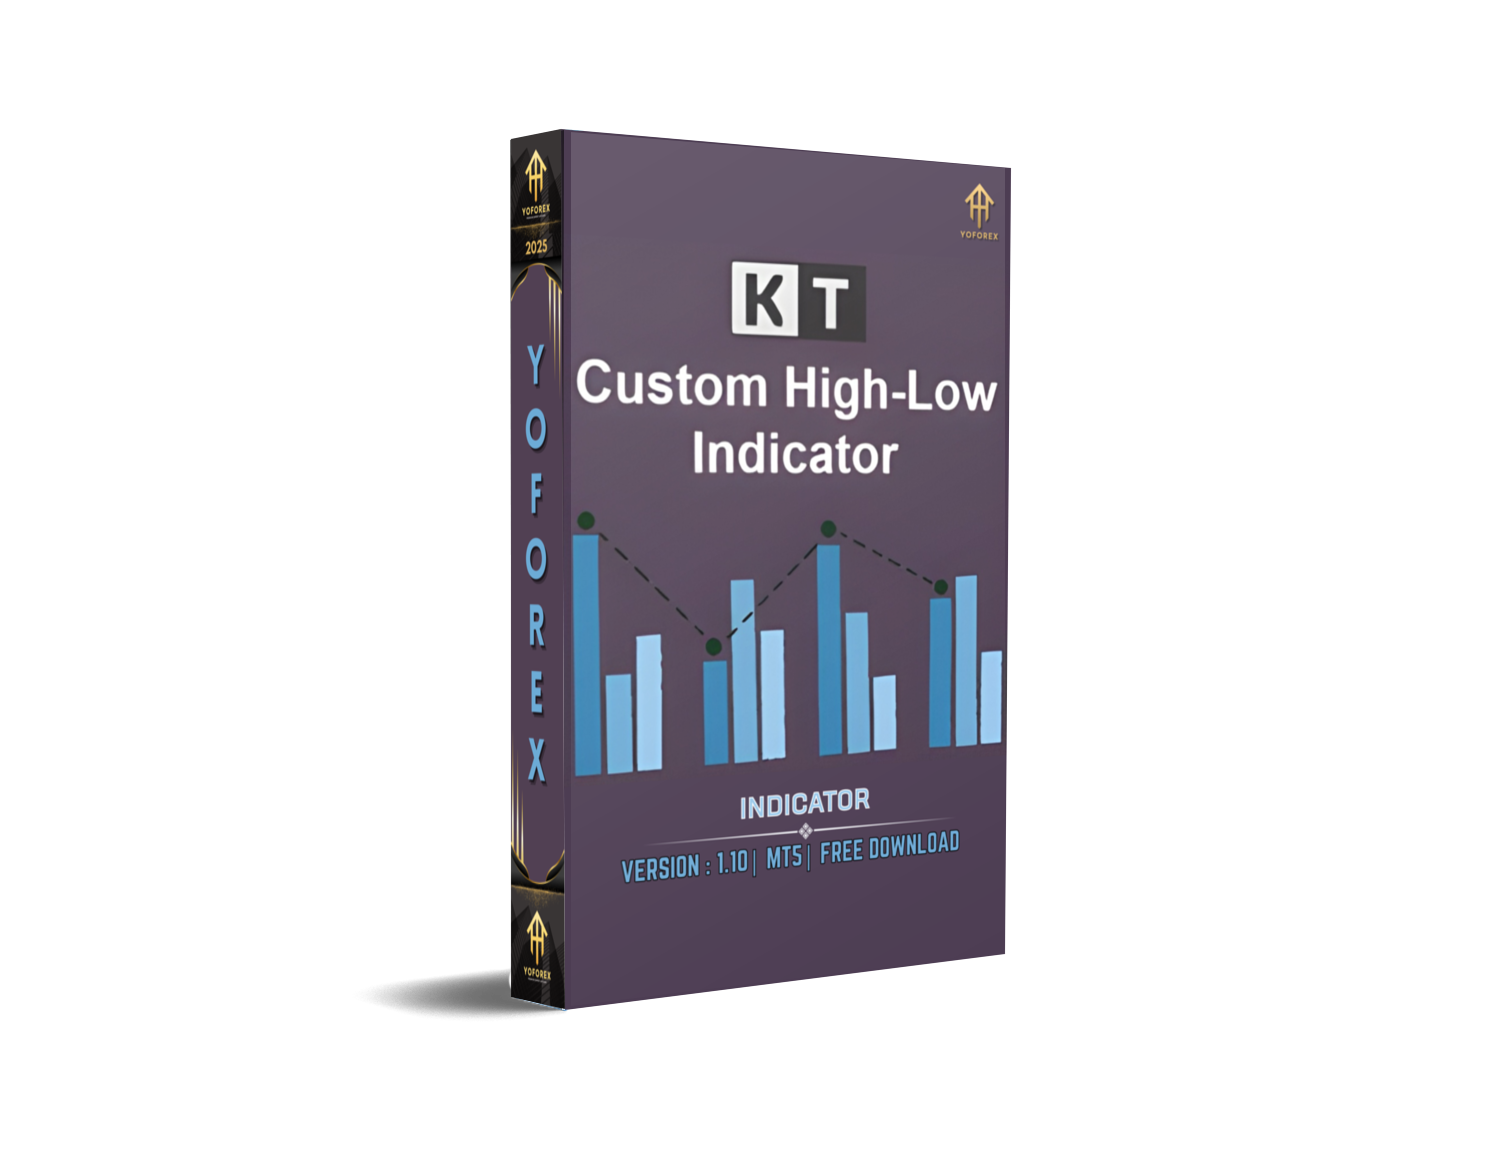
If you're an MT5 trader who relies on key price levels to analyze trends and market behavior, the KT Custom High Low Indicator for MT5 can be a game-changer. This MetaTrader 5 tool helps identify daily, weekly, and monthly high-low levels directly on your chart, streamlining your technical analysis process and improving trading decisions. Whether you're a scalper, intraday trader, or swing trader, this indicator can help highlight important support and resistance zones based on historical and real-time market data.
What Is KT Custom High Low Indicator for MT5?
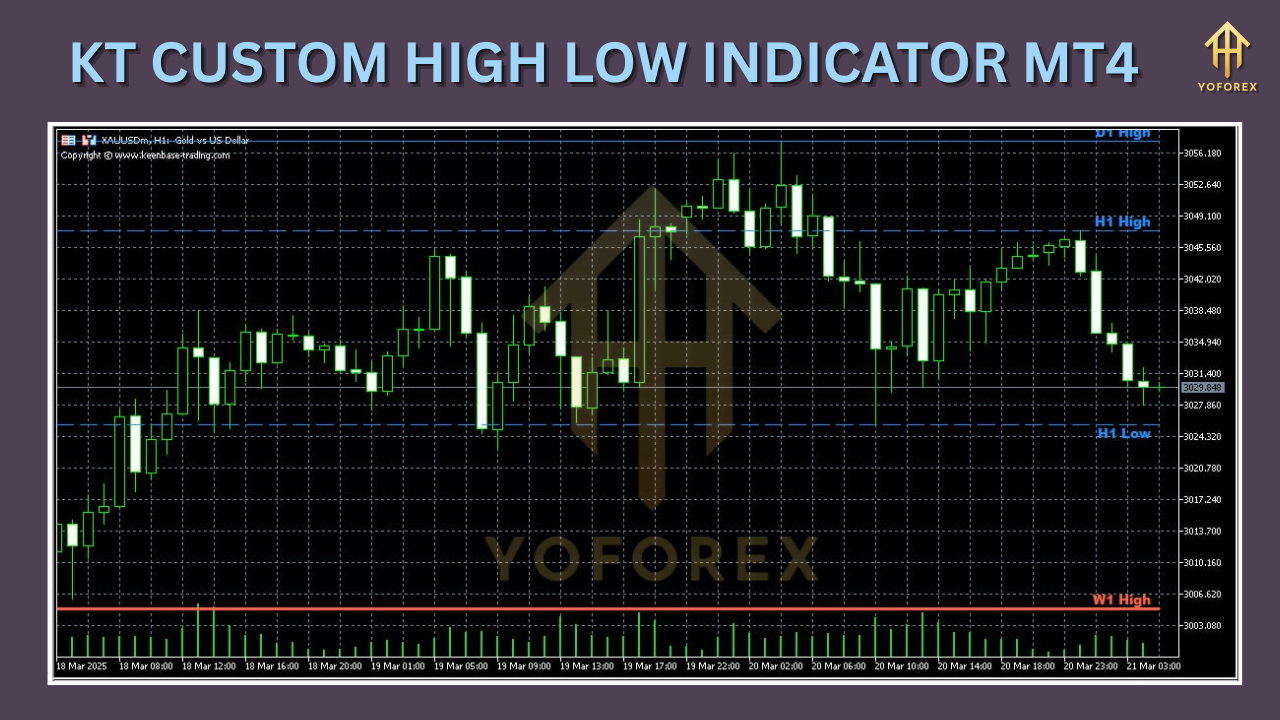
The KT Custom High Low Indicator for MetaTrader 5 is a technical tool that automatically plots the high and low levels of any timeframe you select—daily, weekly, or monthly—onto your trading chart. This information is crucial in identifying price action patterns, breakout zones, and reversal points. The indicator reduces the need to manually analyze charts, offering a cleaner, faster way to track these important price levels.
Unlike many other basic high-low indicators, this one includes additional customization features such as the ability to change line colors, styles, and labels. You can configure it to show the current period’s high/low or extend previous levels into the current trading session. This flexibility is what makes the KT Custom High Low Indicator stand out from the rest.
Key Features of KT Custom High Low Indicator MT5
- Automatic Plotting: Plots daily, weekly, and monthly highs and lows without manual intervention.
- Multiple Timeframe Support: You can switch between different periods or enable multiple timeframes simultaneously.
- Custom Styling: Modify line styles, widths, and colors to suit your trading template.
- Display Labels: Choose whether or not to display the name of each line (Daily High, Weekly Low, etc.).
- Extended Line Options: Extend previous period levels into the current session to visualize potential breakout or retracement zones.
- Minimal Lag: Real-time updates as price levels change, ensuring accuracy.
- Lightweight: Optimized for performance with minimal impact on chart speed.
How It Helps in Trading
1. Breakout Confirmation
Many traders wait for a breakout above the previous high or a breakdown below the previous low to enter trades. The KT Custom High Low Indicator helps confirm such breakouts by highlighting those exact zones, saving time and improving precision.
2. Support and Resistance Zones
Highs and lows are often used to identify support and resistance levels. These zones act as psychological levels in the market. This indicator clearly outlines them, making it easier to decide entry and exit points.
3. Trend Identification
By observing whether prices are consistently making higher highs or lower lows compared to previous sessions, traders can quickly determine the direction of a trend. This tool simplifies trend observation with clear visual lines on the chart.
4. Scalping & Intraday Advantage
Scalpers often rely on very short-term fluctuations, and knowing where the daily high or low is can determine whether a price move is nearing exhaustion or still has room to run.
5. Historical Data Backtesting
This indicator also helps in analyzing how price behaved near previous highs and lows. You can backtest strategies more effectively with the clearly marked levels.
Why Choose KT Custom High Low Over Built-In Indicators?
Most built-in MT5 indicators do not allow the level of customization that KT Custom High Low offers. Furthermore, it consolidates multiple tools into one—meaning you won’t need to clutter your charts with separate indicators for daily, weekly, and monthly levels. The customization aspect also enhances readability, allowing you to match your analysis style and trading template.
Customization Options
KT Custom High Low Indicator allows traders to tailor their chart visuals through settings like:
- Enable or disable any time frame (Daily, Weekly, Monthly)
- Change line colors for each period for easy visual separation
- Add or remove labels next to lines
- Define how far back historical levels should be displayed
- Option to display only previous period levels for a cleaner chart
These features help traders personalize their workspace while still keeping things intuitive and useful.
Compatible Strategies
This indicator is highly compatible with a wide range of strategies, including:
- Price Action Trading
Recognize key reversal or breakout points by watching how candles behave around plotted high/low lines. - Support/Resistance Breakout Strategy
Use high-low levels as breakout confirmation points for entering long or short trades. - Range-Bound Strategy
When markets are ranging, these levels become your range borders. You can go long near the low and short near the high. - Trend Following Strategy
Observe if price is consistently making new highs or lows. This can serve as confirmation of an ongoing trend. - Mean Reversion Strategy
Watch how the price reacts near historical highs and lows—if it bounces back, you could potentially trade the reversion.
Installation and Setup
- Download the KT Custom High Low Indicator file (.ex5 or .mq5 format).
- Open your MetaTrader 5 platform.
- Go to
File→Open Data Folder. - Navigate to
MQL5→Indicators. - Paste the downloaded file into this folder.
- Restart MetaTrader 5 or refresh the Navigator.
- Locate the indicator in the Navigator panel, drag it to your chart, and customize the settings as per your preference.
System Requirements
- MetaTrader Version: MetaTrader 5 (MT5)
- Operating System: Windows, macOS (via Wine), or compatible mobile trading platforms
- Low resource usage—no performance lag even with multiple instances
Final Thoughts
The KT Custom High Low Indicator MT5 is a practical tool that gives traders a visual advantage by automatically marking crucial market levels. Whether you're trading breakouts, watching for reversals, or looking to identify key zones of support and resistance, this indicator can save time and reduce analysis errors.
For anyone serious about improving their technical analysis workflow, this is one indicator that belongs in your trading toolkit. Easy to install, highly customizable, and effective across all timeframes—it simplifies market structure and gives traders clearer insight.
If you're looking to streamline your analysis and gain an edge in your trading strategy, the KT Custom High Low Indicator for MT5 is a worthy investment.
⚡️Upgrade
The latest version includes:
- Enhanced line drawing algorithm for improved accuracy
- Option to only display the current timeframe levels
- Better performance with low CPU usage
- Bug fixes for label misalignment in certain timeframes
Comments (0)
No comments yet. Be the first to comment!
Leave a Comment